
How Does qPCR Work? A Clear, Practical Guide to Real-Time PCR
If you've ever taken a PCR-based COVID test, followed a gene expression study, or watched a lab confirm a pathogen in food or water, you've depended on qPCR — whether you realized it or not. It's one of the true workhorses of molecular biology. And yet the question of how qPCR work still trips up plenty of students, new lab techs, and even experienced researchers who learned the pipetting recipe by heart but never quite saw the logic underneath it. Here's the short answer: qPCR copies a specific stretch of DNA millions of times and measures those copies as they are being made, in real time, using fluorescence. That “real time” part is the whole trick. It's what separates qPCR from the older end-point PCR most of us met in an introductory biology course, where you only saw the result at the very end on a gel. In this guide, we'll walk through how qPCR works from the ground up — the reaction components, the temperature cycling, the fluorescent chemistry, and how to actually read the curves your instrument spits out. By the end, the numbers on your amplification plot should feel a lot less mysterious.
What Is qPCR, and Why Does It Matter?
qPCR stands for quantitative polymerase chain reaction. You'll also hear it called real-time PCR, and the two names describe the same technique from two angles. “Quantitative” tells you the goal — measuring how much of a target sequence is present. “Real-time” tells you the method — watching the amplification happen cycle by cycle instead of waiting until the end. Classic PCR answers a yes-or-no question: is my target sequence there? You run the reaction, load the product onto an agarose gel, and look for a band. It's powerful, but it's essentially end-point analysis. By the time you look, the reaction has usually plateaued, so a bright band and a faint band can represent wildly different starting amounts.qPCR fixes that. Because you're measuring signal at every cycle, you can catch the target during the brief window when amplification is still exponential and still proportional to how much template you started with. That single change turns PCR from a detector into a precise measuring instrument — which is exactly why it underpins so much of modern diagnostics and research.
How Does qPCR Work? The Core Idea
At its heart, qPCR is ordinary PCR with a fluorescent reporter riding along. Every time the target sequence is copied, the amount of fluorescence in the tube ticks up. The instrument — a thermal cycler with a built-in optical detector — reads that fluorescence after every cycle and plots it for you.So the machine is really doing two jobs at once:• Amplifying the target DNA through repeated heating and cooling cycles, just like standard PCR.• Detecting the growing pool of copies by measuring how bright the reaction becomes over time. The more target you started with, the fewer cycles it takes for the signal to rise above background. That relationship — starting amount versus the cycle where signal appears — is the foundation of every qPCR measurement you'll ever make.
From Standard PCR to Real-Time Measurement
To really understand how qPCR works, it helps to remember what a single PCR cycle does. Each cycle runs through three temperatures:• Denaturation (~95°C): the double-stranded DNA melts apart into two single strands.• Annealing (~55–65°C): short primers bind to the single strands, flanking your target sequence.• Extension (~72°C): a heat-stable DNA polymerase builds a new complementary strand from each primer. Repeat that cycle 35–45 times and, in theory, you double your target with every round — one copy becomes two, two become four, four become eight, and so on into the billions. (Many modern assays actually combine annealing and extension into a single step, so you'll often see two-step cycling in practice.)Standard PCR stops there and checks the result at the finish line. qPCR simply adds a camera to the process, snapping a fluorescence reading at the end of every cycle so you can watch that doubling happen live.
The Building Blocks of a qPCR Reaction
Before any cycling begins, you need to assemble the reaction. A typical qPCR mix contains:• Template — the purified DNA (or cDNA) that holds your target sequence.• Primers — a pair of short DNA sequences that define exactly which region gets copied.• DNA polymerase — usually a hot-start version of Taq polymerase, which stays inactive until a heat step “switches it on,” reducing non-specific products.• dNTPs — the A, T, C, and G building blocks the polymerase stitches together.• Buffer and magnesium — to keep the pH stable and give the enzyme the ions it needs to work.• A fluorescent reporter — either an intercalating dye or a sequence-specific probe (more on both below).In practice, most people don't pipette all of these separately. They reach for a master mix — a single pre-blended tube that already contains the polymerase, dNTPs, buffer, magnesium, and reporter chemistry. You just add your primers and template. This is where shelf-stable formats shine: ready-to-use lyophilized qPCR master mix beads pack a full single reaction into one freeze-dried sphere that dissolves in seconds, ships without a cold chain, and cuts down on the pipetting steps where errors creep in.
Why Clean Template Is Half the Battle
No reagent can rescue a bad sample. qPCR is exquisitely sensitive, which means it's just as happy to amplify contaminants and inhibitors as it is to amplify your target. Leftover proteins, salts, ethanol, or degraded nucleic acids can all suppress the reaction and skew your numbers.That's why sample preparation matters so much. Purifying your DNA or RNA up front — often with magnetic bead–based extraction — gives the enzyme a clean field to work in and makes the whole downstream measurement more reliable and reproducible. Garbage in really does mean garbage out here.
How Does qPCR Work Step by Step?
Let's put the pieces in motion. Here's the sequence of events once you load your plate and hit start: 1. Set-up and initial activation. The instrument holds the reaction at a high temperature (often 95°C for a couple of minutes) to activate the hot-start polymerase and fully denature the template.2. Cycling begins. The machine cycles through denaturation, annealing, and extension, doubling the target with each round — the same engine that drives all PCR.3. Fluorescence is measured every cycle. This is the defining feature. After each cycle's extension step, the optical system excites the fluorescent reporter and records how much light comes back. Early on, there are too few copies to see anything above background. As copies accumulate, the signal climbs.4. The signal crosses a threshold. At some point the fluorescence rises clearly above the background noise. The cycle number where that happens is your key result — the quantification cycle.5. A melt curve (optional) confirms specificity. If you used an intercalating dye, the run often ends with a slow temperature ramp that “melts” the products apart, letting you confirm you made one clean product rather than a mix of junk. That fourth step is where the quantitative magic lives, so let's zoom in on it.
Reading the Results: Cq Values and Amplification Curves
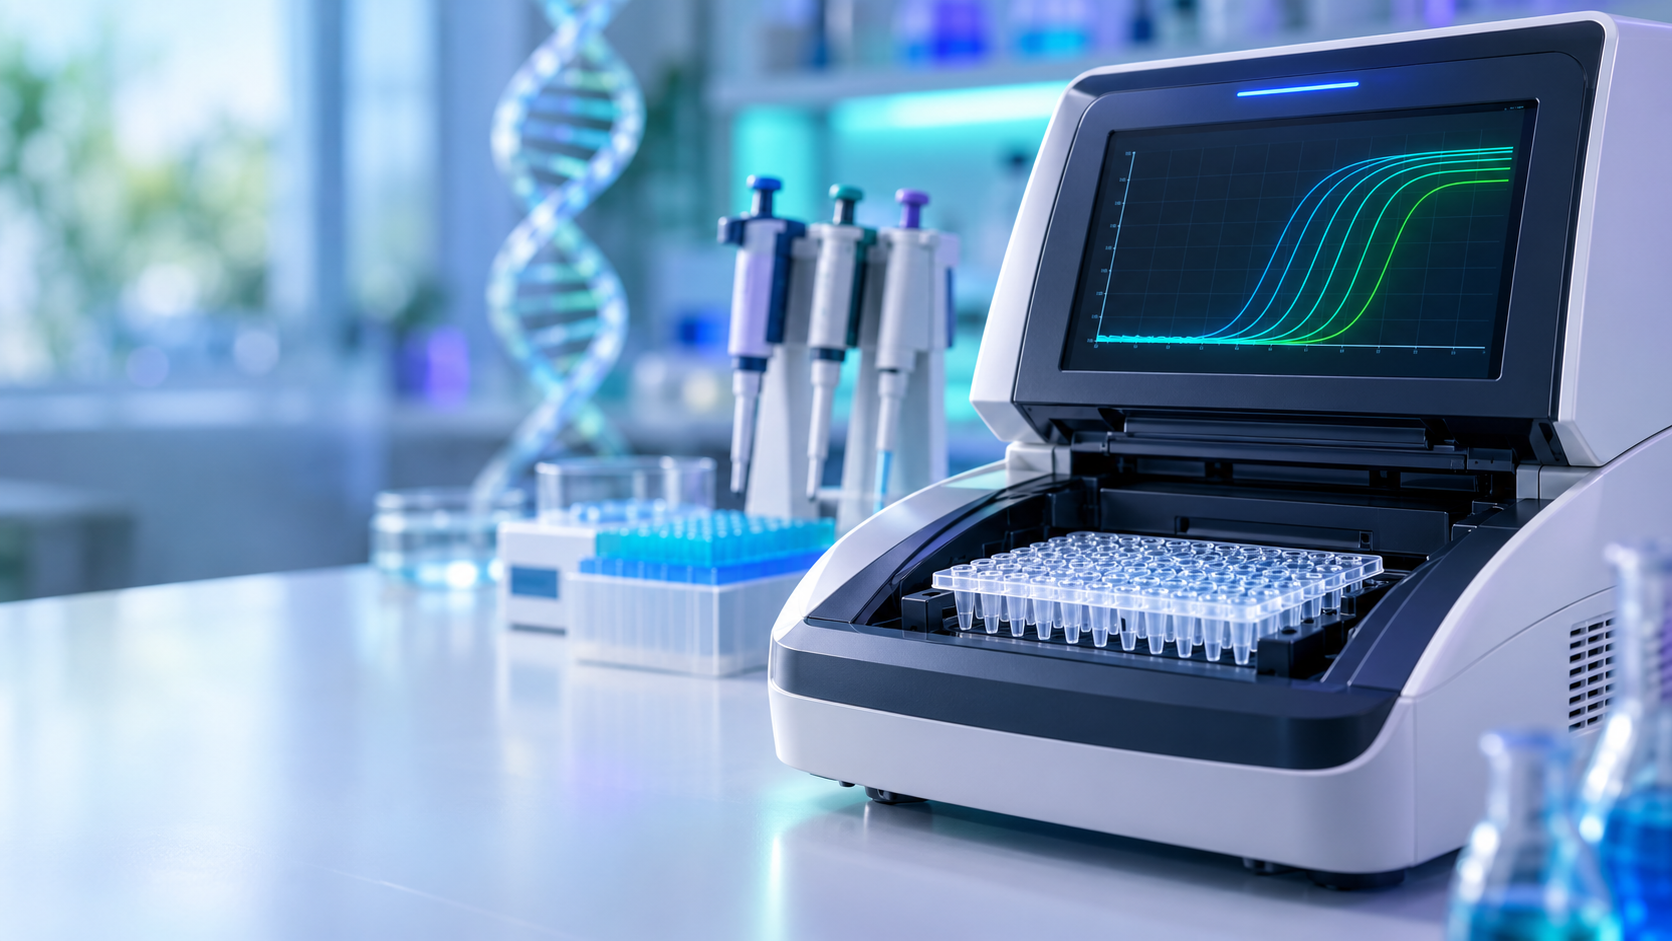
Plot fluorescence (vertical axis) against cycle number (horizontal axis) and you get the classic S-shaped amplification curve. It has three regions:• Baseline: the flat early phase where copies exist but the signal hides in the background.• Exponential phase: the steep climb where the target reliably doubles each cycle. This is the informative part.• Plateau: the flattening tail, where reagents run low, and the reaction slows and stops.Now draw a horizontal threshold line across the exponential phase, just above the background noise. The cycle at which each sample's curve crosses that line is its Cq value — the quantification cycle, also written as Ct (cycle threshold). These terms mean the same thing.
What the Cq Value Actually Tells You
The Cq is the single most important number in qPCR, and it works in a way that's easy to get backwards, so it's worth stating plainly:A lower Cq means more starting template. A higher Cq means less. Think about why. If you began with lots of target, it only takes a few cycles of doubling to cross the threshold, so the curve rises early and the Cq is low. If you began with just a trace, you need many more cycles to build up enough signal, so the curve rises late and the Cq is high. A difference of one Cq roughly corresponds to a two-fold difference in starting material — which is why even small, consistent Cq shifts are meaningful.
Absolute vs. Relative Quantification
Once you have Cq values, there are two ways to turn them into an answer, depending on your question. Absolute quantification tells you the exact number of copies in a sample. You build a standard curve by running a dilution series of a known standard, plotting Cq against the known concentrations, and then reading your unknowns off that line. This approach is used for things like viral load, where clinicians need a hard number. Relative quantification tells you how much a target changed compared with a control — for instance, whether a gene is expressed more in treated cells than untreated ones. Here you compare your target's Cq to a stable reference (housekeeping) gene and often to a control condition, using the widely cited 2^-ΔΔCq method. You don't get absolute copies, but you get a clean fold-change, which is exactly what gene expression studies usually need.A quick note on efficiency: a perfect reaction doubles the target every cycle (100% efficiency), which shows up as a standard curve with a slope of about −3.32. Good assays generally sit between 90% and 110%. Efficiency far outside that range is a warning sign that your primers, template quality, or reagents need attention.
RT-qPCR: How Does qPCR Work for RNA?
Plenty of the most important targets — viral genomes like SARS-CoV-2, messenger RNA for gene expression — are made of RNA, and DNA polymerase can't read RNA directly. So how does qPCR work when your starting material is RNA? The answer is an extra front-end step called reverse transcription (RT). An enzyme called reverse transcriptase first copies the RNA into complementary DNA (cDNA), and then qPCR proceeds exactly as described above. The combined workflow is called RT-qPCR, and it can be run two ways:• One-step: reverse transcription and qPCR happen in the same tube, back to back. Fewer handling steps, less contamination risk.• Two-step: you make cDNA first, then use it in separate qPCR reactions. More flexible if you want to test one sample against many targets. This is precisely the workflow behind most molecular COVID tests and countless gene expression experiments — and it's why RT-qPCR master mix formats that bundle the reverse transcriptase and polymerase chemistry together are so popular in high-throughput labs.
Where qPCR Is Used
Understanding how qPCR works opens the door to an enormous range of applications, including: • Clinical diagnostics — detecting and quantifying pathogens, from respiratory viruses to bloodborne infections.• Gene expression analysis — measuring how strongly specific genes are switched on or off.• Food and environmental testing — screening for contamination, spoilage organisms, or GMOs.• Genotyping — distinguishing single-nucleotide differences (SNPs) between samples.• Copy number and load studies — tracking gene amplifications or viral titers over time.The common thread is sensitivity and speed: qPCR can detect a handful of target molecules and give you a quantitative answer in an hour or two, without ever opening the tube after the run — which also keeps contamination in check.
Detection Chemistries: Dyes vs. Probes
We've mentioned the fluorescent reporter a few times, so let's finish by comparing the two chemistries you'll meet most often.
SYBR Green (Intercalating Dyes)
SYBR Green is a dye that glows brightly only when it slips into double-stranded DNA. As qPCR builds more and more double-stranded product, more dye binds, and the signal rises. It's simple and inexpensive, and it works with any pair of primers — no custom probe required.The catch is that it binds any double-stranded DNA, including primer-dimers and non-specific products. That's why SYBR Green runs usually end with a melt curve to confirm you amplified a single, correct product.
TaqMan Probes (Hydrolysis Probes)
TaqMan chemistry uses a short probe that sits between the two primers and carries two labels: a reporter dye on one end and a quencher on the other. While they're close together, the quencher soaks up the reporter's signal, so the probe stays dark. During extension, the polymerase's built-in cutting activity chops the probe apart, freeing the reporter from the quencher — and now it fluoresces.Because the probe only binds your specific target, this approach is highly sequence-specific. It also lets you label different targets with different colors and measure several at once in a single tube (multiplexing), which is why so many diagnostic panels rely on it.
Common Pitfalls (and How to Avoid Them)
Even a well-designed assay can go sideways. A few habits save a lot of grief:• Always run a no-template control (NTC). If it shows signal, you have contamination or primer-dimers to fix before trusting anything else.• Include reference genes and, ideally, replicates. Relative quantification is only as good as its normalization.• Mind your template quality. Inhibitors carried over from extraction are a leading cause of odd efficiencies and late Cq values.• Follow the MIQE guidelines. This published set of minimum standards for reporting qPCR experiments keeps your data transparent and reproducible — and reviewers will thank you.• Standardize your reagents. Batch-to-batch variability in home-brewed mixes is a subtle source of drift; consistent, pre-formulated reagents remove one big variable.
Final Thoughts
So, how does qPCR work? Boiled all the way down: it amplifies a specific DNA sequence through repeated temperature cycles while a fluorescent reporter reveals how many copies exist at every step. The cycle where the signal crosses your threshold — the Cq — tells you how much target you started with, and from there you can measure copies absolutely or compare conditions relatively.Once that mental model clicks, the amplification plots stop looking like abstract squiggles and start reading like a clear story about your sample. And because qPCR is only as good as the reagents and template feeding it, standardizing those inputs — clean extraction and consistent, ready-to-use chemistry — is one of the highest-leverage things you can do for reliable results. Want to see how shelf-stable, freeze-dried reagent beads fit into a qPCR or RT-qPCR workflow? Explore the full range of EVIK™ DxSpheres, browse the FAQs, or reach out to the team with questions about your specific assay.
Vladimir Evtodienko
Share this article
CEO, Founder- IVD Technology